Fuel costs in 2026
Fuel is usually a haulier's biggest cost after wages, and it is one of the few large costs you can actually control. The Government has given some short-term relief. On 20 May 2026 it extended the 5p fuel duty cut to 31 December 2026 and gave HGVs a 12-month vehicle excise duty holiday, paying £1, for renewals from 1 July 2026. The HGV Road User Levy is still payable. None of this changes what happens on your own vehicles, and the duty cut has an end date. Plan your 2027 budgets with that in mind and watch the Government's next fiscal announcements.
The savings that last come from how vehicles are driven, maintained, routed and managed. Those are compliance questions as much as cost questions, which is why we approach them through your compliance records.
Where your fleet is burning money
Most fuel waste is invisible until someone looks for it. These are the six biggest drains we find.
Driver behaviour
Harsh acceleration, late braking, poor anticipation and unnecessary idling are the largest controllable fuel cost. Tachograph and telematics data shows who, where and how much.
Excessive idling
Engines left running while drivers load, wait or take a break burn fuel without moving a mile, and on a large fleet a few minutes per vehicle per day adds up quickly. Your tachograph and telematics data shows how much idling each vehicle actually does, and that is the figure we work from. Idling is also an offence: regulation 98 of the Road Vehicles (Construction and Use) Regulations 1986 requires drivers to stop the engine when stationary, where needed to prevent noise or exhaust emissions.
Maintenance defects
Under-inflated tyres, dragging brakes, faulty injectors, air leaks and misaligned axles all increase fuel use. We cross-reference defect and inspection records with fuel data to find the pattern.
Route inefficiency
Unplanned routes, unnecessary mileage, empty running and poor load planning add fuel cost that is rarely measured. We compare the miles you run with the miles the work needs.
No fuel policy
Without a clear, enforced fuel policy, drivers have no targets, managers have no accountability, and the fleet has no benchmark to improve against.
No MPG benchmarking
If you are not tracking miles per gallon by vehicle and by driver, you cannot manage fuel spend. Many operators only see the total on the fuel card invoice.
Why a compliance-led audit works
The data you already keep for compliance is the best fuel data you have. Tachograph records show driving time, speed and activity. Telematics, where fitted, adds idling, harsh events and location. Your inspection sheets and defect reports show the mechanical problems that waste fuel. Your fuel card data shows what was actually bought, by vehicle.
Looking at them together gives a far clearer picture than a fuel report alone. A vehicle with poor MPG and a history of brake and tyre defects needs a workshop conversation. A driver with poor MPG in a sound vehicle needs coaching. A route with poor MPG on every vehicle needs replanning.
It also fits what accreditation now asks for. From 1 September 2026, FORS Standard v7.2 requirement O2 expects accredited operators to collect fuel data by vehicle registration, including AdBlue where relevant and the diesel-to-AdBlue ratio. An operator that does not calculate the ratio gets a minor action point. A properly run fuel audit gives you that data as a by-product. If you are working towards FORS, see our FORS accreditation page.
Speed and the limiter
HGV speed limiters are set at 90 km/h, about 56 mph. The motorway limit for goods vehicles over 7.5 tonnes is 60 mph, so the limiter is the effective cap. Fuel use climbs steeply at the top of that range. Many operators find savings by asking drivers to cruise below the limiter on suitable work, as long as the schedule allows it. We check that your delivery windows and drivers' hours planning make that realistic, rather than setting a target drivers cannot meet.
Tyres and maintenance: the quiet losses
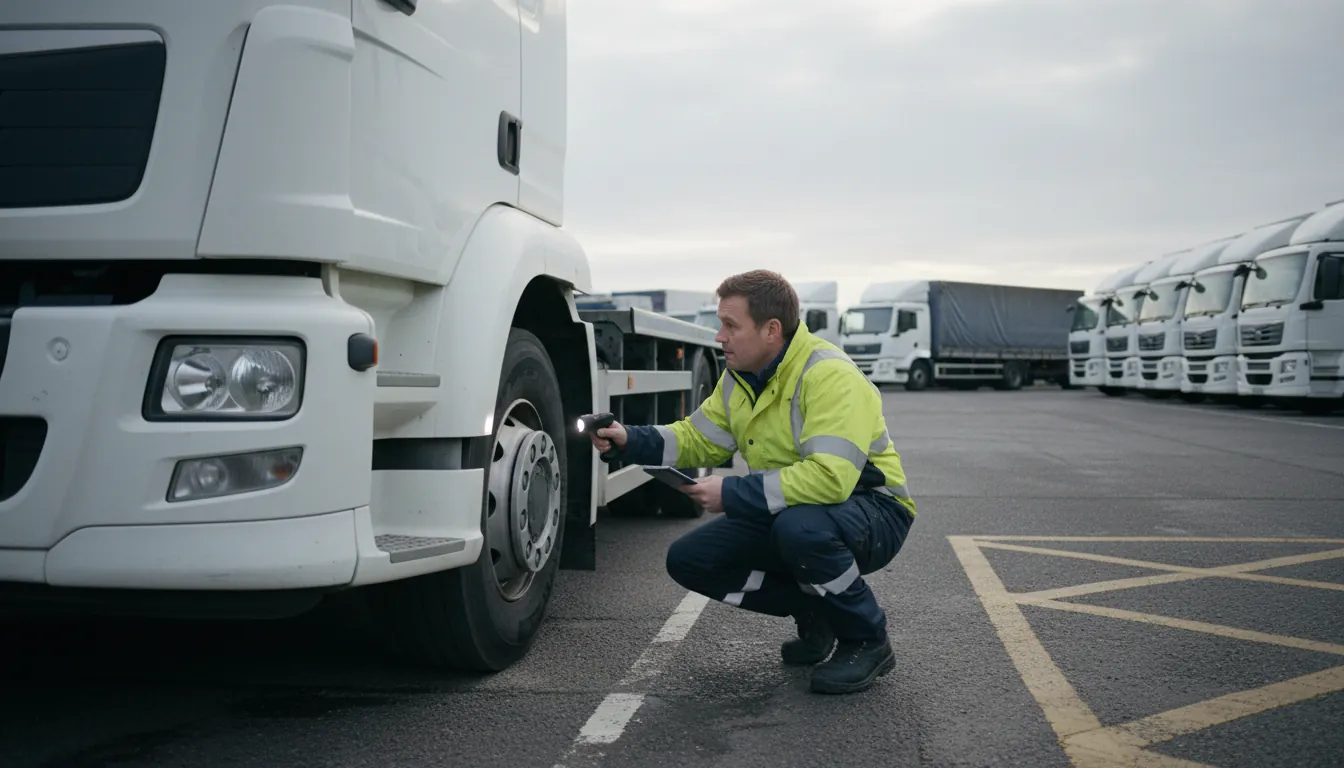
Tyre condition is already part of every walkaround check and every safety inspection under DVSA's Guide to Maintaining Roadworthiness, and FORS has a tyre management requirement (V7). The same checks that keep a vehicle legal also keep fuel use down. Pressures that drift low, mismatched tyres on an axle, poor alignment and binding brakes all add rolling resistance. The fix is rarely expensive. It is usually a matter of making sure pressure checks happen, that low readings are recorded as defects, and that someone follows them up. We look at whether your system does that in practice, not just on paper.
What goes into a fuel policy that works
- clear rules on idling, including heating and cooling the cab, with sensible exceptions;
- expectations on speed and cruise control for each type of work;
- how drivers record fuel and AdBlue, and what to do when a pump receipt and the card do not match;
- pre-trip planning, including traffic, loading times and refuelling points;
- tyre pressure checks as part of the daily walkaround;
- how MPG is measured and fed back, and how good performance is recognised;
- how repeated poor performance is handled, fairly and with coaching first.
A policy works when drivers understand why it exists and see the results. We help you brief it, not just issue it.
Fuel card controls and fuel security
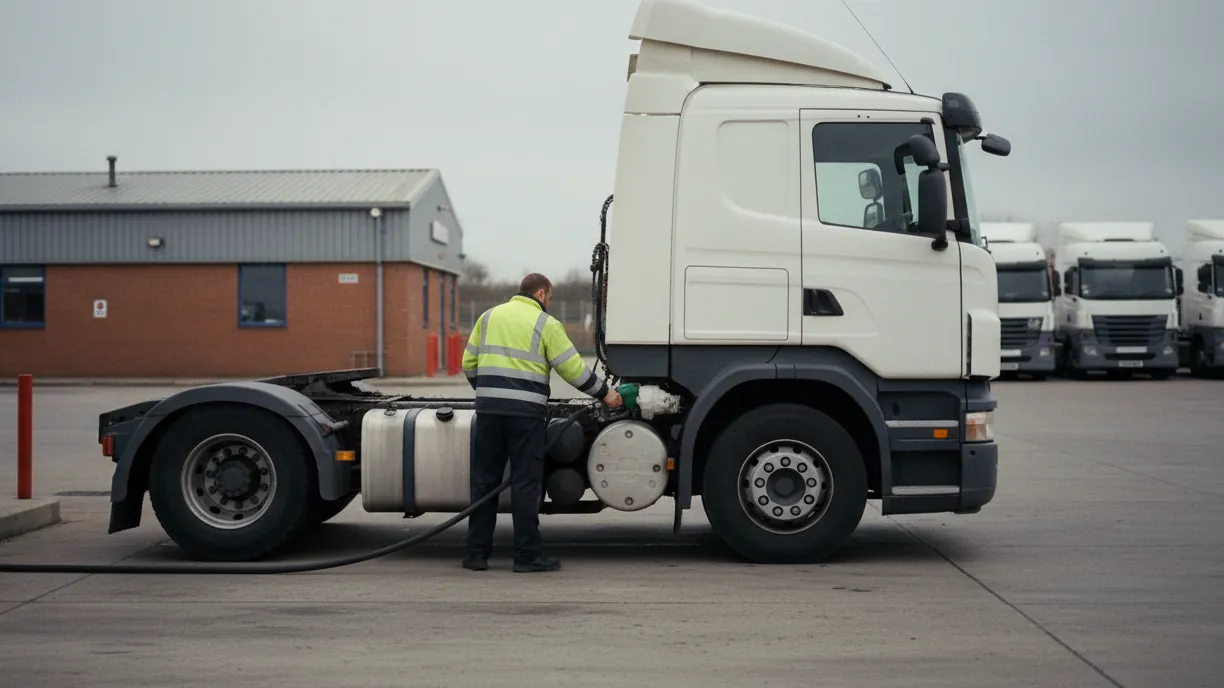
Some fuel loss is not about efficiency at all. Fuel cards without vehicle or product limits, odometer readings that are never checked, and unexplained top-ups are common findings. Diesel theft from tanks at unsecured sites is another. We review card controls, reconcile fuel purchases against mileage, and flag transactions that need explaining. Most of the time the answer is an innocent error, but a fleet that never checks has no way of knowing.
How the J&JL fuel audit works
A structured, four-stage process that gives you a clear picture of fuel spend and a practical plan to reduce it.
- Tachograph and telematics review. We analyse driver data for idling, harsh events, speed profiles and MPG trends, vehicle by vehicle and driver by driver.
- Vehicle maintenance audit. We review defect records, inspection histories, tyre management and service intervals to find mechanical issues that quietly burn fuel.
- Policy and process review. We assess your fuel policy, routing and load planning, fuel card controls and driver briefings, and identify the gaps that drive avoidable cost.
- Action plan and implementation. You receive a prioritised action plan with savings targets, a driver briefing pack and a fuel KPI dashboard you can use every month.
Where the savings come from
Every fleet is different, so we do not quote a saving until we have seen your data. What we can tell you is where savings usually sit, and the audit shows which of these matter most for you.
| Area | How the saving is made |
|---|---|
| Driver behaviour | Data-led coaching and targeted briefings on acceleration, anticipation and idling, reviewed after 90 days |
| Tyres and maintenance | Correct tyre pressures, defect follow-up and maintenance linked to fuel data |
| Idling | A clear idling policy, enforced through data and driver briefings |
| Route and load planning | Less empty running and fewer unnecessary miles, especially on multi-drop work |
Most fleets have one or two areas where the bulk of the saving sits. The audit tells you which, and puts a figure on it from your own records.
Load planning and empty running
For many fleets the single largest saving is not in how vehicles are driven but in how much they drive. Empty return legs, part loads that could be combined, multi-drop sequences built around habit rather than geography, and vehicles too large for the work all add miles. We compare the work you carry with the miles you run, and show where planning changes would cut mileage without breaking delivery windows or drivers' hours.
What operators get wrong
- Buying telematics and never acting on the reports.
- Setting MPG targets without allowing for vehicle type, payload and route.
- Coaching drivers once, then never measuring whether it stuck.
- Treating tyre pressures as a workshop job only, instead of part of the daily walkaround.
- Fuel cards with no vehicle or mileage controls, which makes misuse and errors hard to spot.
- Not recording AdBlue at all, which now matters for FORS.
What J&JL delivers
- a fuel audit report covering drivers, vehicles, routes and policy, with the evidence behind each finding;
- a prioritised action plan with savings targets;
- a written fuel and idling policy for your drivers;
- a driver briefing pack and coaching approach;
- a fuel KPI dashboard: MPG by vehicle and driver, idling, AdBlue ratio and cost per mile;
- a follow-up review to check the savings are holding.
Most of what we find is visible within weeks of receiving your data. Driver behaviour changes take longer to show in the figures, which is why we review them again at 90 days.
If your walkaround checks, defects and inspections are scattered across paper and spreadsheets, Roadworthy, our fleet compliance software, brings them together and includes tachograph analysis through Tachomaster integration, which makes the maintenance side of a fuel audit much quicker.
Sources and further reading
- Chancellor protects drivers and businesses from rising fuel costs (GOV.UK, 20 May 2026)
- Road Vehicles (Construction and Use) Regulations 1986, regulation 98 (legislation.gov.uk)
- FORS Standard v7 transitional arrangements (FORS)
- FORS Standard version 7 (FORS)
- Speed limits (GOV.UK)
Checked against the sources above on 5 October 2026.